Tiger Leaping Gorge upper trail hike elevation profile
25 May 2019 | all notes
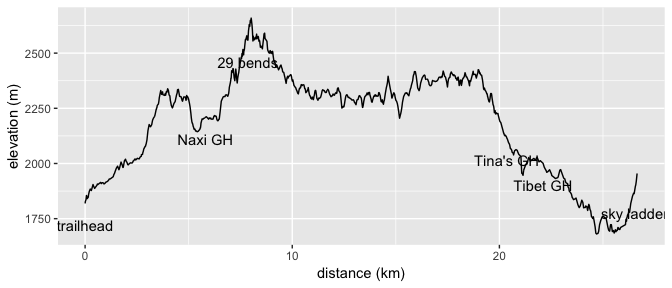
Given how well-known and oft-hiked the Tiger Leaping Gorge trail in Southwest China is, it’s surprising how difficult it is to find proper hiking maps of the area. Most of the maps specific to the longer ‘upper trail’ hike being hand-drawn is one thing (for example check out this eclectic gallery), if they weren’t also across the bank spectacularly bad at communicating exactly what kind of terrain to expect. Having hiked it, here is something like the elevation contour map that I wish I’d made before, built from trail data extracted from OpenStreetMap in combination with ASTER Global Digital Elevation Map data.
curl::curl_download("https://github.com/kevinstadler/TigerLeapingGorge/archive/master.zip", "TigerLeapingGorge.zip")
utils::unzip("TigerLeapingGorge.zip", junkpaths = TRUE)
tlg <- rgdal::readOGR("TigerLeapingGorge.shp")
## OGR data source with driver: ESRI Shapefile
## Source: "/Users/kevin/kevinstadler.github.io/_posts/TigerLeapingGorge.shp", layer: "TigerLeapingGorge"
## with 1 features
## It has 1 fields
coords <- sp::coordinates(tlg)[[1]][[1]]
# calculate pairwise distances between points (in meters)
deltaxy <- raster::pointDistance(coords[-nrow(coords), ], coords[-1, ], lonlat=TRUE)

dem <- raster::raster("ASTGTM2_N27E100_dem.tif")
# if the density of the raster was higher than that of the vector points, this
# step would actually lose some of the elevation information
elevation <- raster::extract(dem, coords, method="bilinear")

# alternatively (inefficient because downloading raster file first, also maybe
# disfunct because mapzen shutdown?)
#elevatr::get_elev_point(coords, src="aws")


data <- data.frame(dist=c(0, cumsum(deltaxy)), elevation=elevation)

# points of interest
poiindex <- c(1, 201, 300, 870, 920, 1034)
poiname <- c("trailhead", "Naxi GH", "29 bends", "Tina's GH", "Tibet GH", "sky ladder")

ggplot2::ggplot(data, ggplot2::aes(x = dist/1000, y=elevation)) + ggplot2::geom_line(color='black') + ggplot2::labs(x="distance (km)", y="elevation (m)") + ggplot2::annotate("text", x=data[poiindex,"dist"]/1000, y=data[poiindex,"elevation"] - 100, label=poiname)
Misc statistics
deltaz <- diff(elevation)
ascent <- sum(deltaz[deltaz > 0])
descent <- sum(deltaz[deltaz < 0])
Total ascent: 3987m
Total descent: -3851m