Archival bias in recorded artworks on Wikidata
02 Nov 2019 | all notes
visualArtworksPerDecade <- WikidataQueryServiceR::query_wikidata('SELECT
  ?decade (COUNT(DISTINCT ?item) as ?count)
WHERE {
  ?item wdt:P31/wdt:P279* wd:Q4502142 .
  ?item wdt:P571 ?inception .
  BIND (YEAR(?inception) AS ?year).
  BIND (10*FLOOR(?year / 10) AS ?decade).
}
GROUP BY ?decade
ORDER BY ?decade')
## 444 rows were returned by WDQS
plot(visualArtworksPerDecade, type='l', xlim=c(1000, 2010), ylim=c(0, max(visualArtworksPerDecade$count)), main='visual artworks per decade recorded in WikiData')
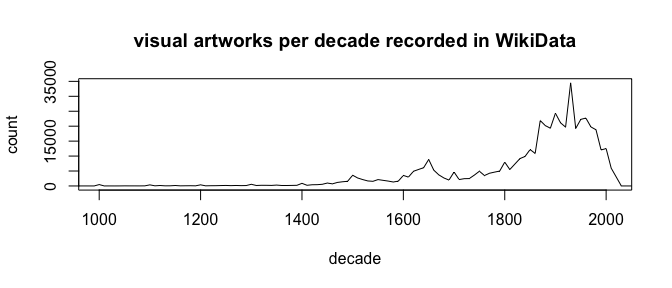
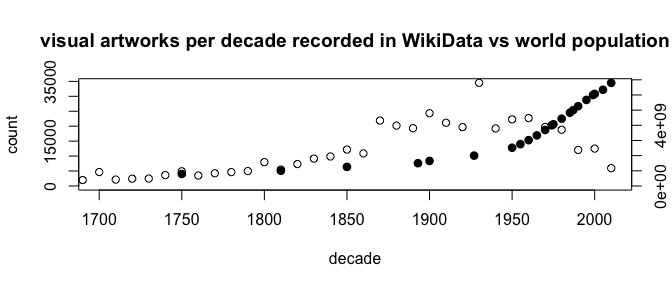
Assuming notable creative output per capita was stable, we should see a correlation between global human population and number of recorded artworks.
worldPopulation <- WikidataQueryServiceR::query_wikidata('SELECT
  ?year ?population
WHERE {
  wd:Q2 p:P1082 ?populationStatement .
  ?populationStatement    ps:P1082 ?population
    ;   pq:P585 ?date .
  BIND(YEAR(?date) AS ?year)
  FILTER (?year >= 1000 && ?year <= 2010)
}
ORDER BY ?year')
## 23 rows were returned by WDQS
xlim <- c(1700, 2010)
plot(visualArtworksPerDecade, xlim=xlim, main='visual artworks per decade recorded in WikiData vs world population')
par(new = T)
plot(worldPopulation, xlim=xlim, ylim=c(0, max(worldPopulation$population)), pch=16, axes=F, xlab=NA, ylab=NA, cex=1.2)
axis(side = 4)
mtext(side = 4, line = 3, 'world population')
Hone in on target artworks (those with a title):
start <- '"1900-01-01"^^xsd:dateTime'
end <- '"2020-01-01"^^xsd:dateTime'

artworksPerYear <- WikidataQueryServiceR::query_wikidata(paste('SELECT
  ?year ?hasTitle (COUNT(DISTINCT ?item) as ?count)
WHERE {
  ?item wdt:P31/wdt:P279* wd:Q4502142 .
  ?item wdt:P571 ?inception .
  BIND(YEAR(?inception) AS ?year)
  FILTER(?inception >= ', start, ' && ?inception < ', end, ')
  OPTIONAL { ?item wdt:P1476 ?title . }
  BIND(BOUND(?title) AS ?hasTitle)
}
GROUP BY ?year ?hasTitle
ORDER BY ?year ?hasTitle'))
## 240 rows were returned by WDQS
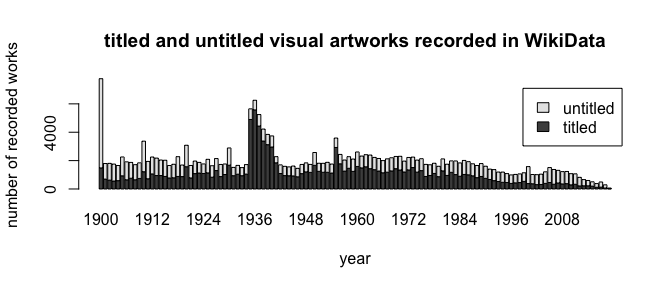
The spikes occurring at 10 year intervals seem to have to do with the fact that works that can only be dated to a decade are conventionally marked as created in the first year of that decade (i.e. 1900, 1910, 1920 etc). The effect holds for both titled and untitled artworks, but it stops completely after 1950 (or perhaps 1955).
counts <- reshape(artworksPerYear, direction = "wide", idvar="year", timevar = "hasTitle")
countMatrix <- t(as.matrix(counts[,3:2]))
rownames(countMatrix) <- c('titled', 'untitled')
colnames(countMatrix) <- counts$year
barplot(countMatrix, main="titled and untitled visual artworks recorded in WikiData",
  xlab="year", ylab="number of recorded works", legend=TRUE) #col=c("darkblue","red"),
#plot(titledArtworksPerYear, ylim=c(0, max(titledArtworksPerYear$count)))
titlesforyear <- function(year) {
    return(WikidataQueryServiceR::query_wikidata(paste('SELECT
  DISTINCT ?item ?itemLabel ?title ?language
WHERE {
  ?item wdt:P31/wdt:P279* wd:Q4502142 .
  ?item wdt:P1476 ?title .
  ?item wdt:P571 ?inception .
  FILTER(?inception >= "', year, '-01-01"^^xsd:dateTime && ?inception < "', year+1, '-01-01"^^xsd:dateTime)
  SERVICE wikibase:label { bd:serviceParam wikibase:language "en" }
  }', sep=''))
)
}
#foo <- titlesforyear(2003)
#titles <- lapply(1990:2000, titlesforyear)
Relevant WikiData classes
Other artwork APIs
- Cultural Objects Name Authority web service API