Perform one or more Mantel permutation tests.
mantel.test.RdPerform correlation tests between pairs of distance matrices. The Mantel
test is different from classical correlation tests (such as those
implemented by cor.test) in that the null distribution
(and significance level) are obtained through randomisation. The null
distribution is generated by shuffling the locations (matrix rows and
columns) of one of the matrices to calculate an empirical null distribution
for the given data set.
mantel.test(x, y, ...)

# S3 method for default
mantel.test(x, y, plot = FALSE, method = c("spearman",
  "kendall", "pearson"), trials = 9999, omitzerodistances = FALSE, ...)

# S3 method for formula
mantel.test(x, y, groups = NULL,
  stringdistfun = utils::adist, meaningdistfun = hammingdists, ...)

# S3 method for list
mantel.test(x, y, plot = FALSE, ...)

# S3 method for mantel
plot(x, xlab = "generation", ...)
Arguments
| x | a formula, distance matrix, or list of distance matrices (see below) |
|---|---|
| y | a data frame, distance matrix, or list of distance matrices of the
same length as |
| ... | further arguments which are passed on to the default method (in
particular |
| plot | logical: immediately produce a plot of the test results (default:
|
| method | correlation coefficient to be computed. Passed on to
|
| trials | integer: maximum number of random permutations to be computed (see Details). |
| omitzerodistances | logical: if |
| groups | when |
| stringdistfun | when |
| meaningdistfun | when |
| xlab | the x axis label used when plotting the result of several Mantel tests next to each other |
Value
A dataframe of class mantel, with one row per Mantel test carried
out, containing the following columns:
methodCharacter string: type of correlation coefficient used
statisticThe veridical correlation coefficient between the entries in the two distance matrices
rsampleA list of correlation coefficients calculated from the permutations of the input matrices
meanAverage correlation coefficient produced by the permutations
sdStandard deviation of the sampled correlation coefficients
p.valueEmpirical p-value computed from the Mantel test: let
ngreaterbe the number of correlation coefficients inrsamplegreater than or equal tostatistic, thenp.valueis(ngreater+1)/(length(rsample)+1p.approxThe theoretical p-value that would correspond to the standard
zscore as calculated above.is.unique.maxLogical,
TRUEiff the veridical correlation coefficient is greater than any of the coefficients calculated for the permutations. If this is true, thenp.value == 1 / (length(rsample)+1)
Multiple mantel objects can easily be combined by calling
rbind(test1, test2, ...).
Details
If the number of possible permutations of the matrices is reasonably close
to the number of permutations specified by the trials parameter, a
deterministic enumeration of all the permutations will be carried out
instead of random sampling: such a deterministic test will return an exact
p-value.
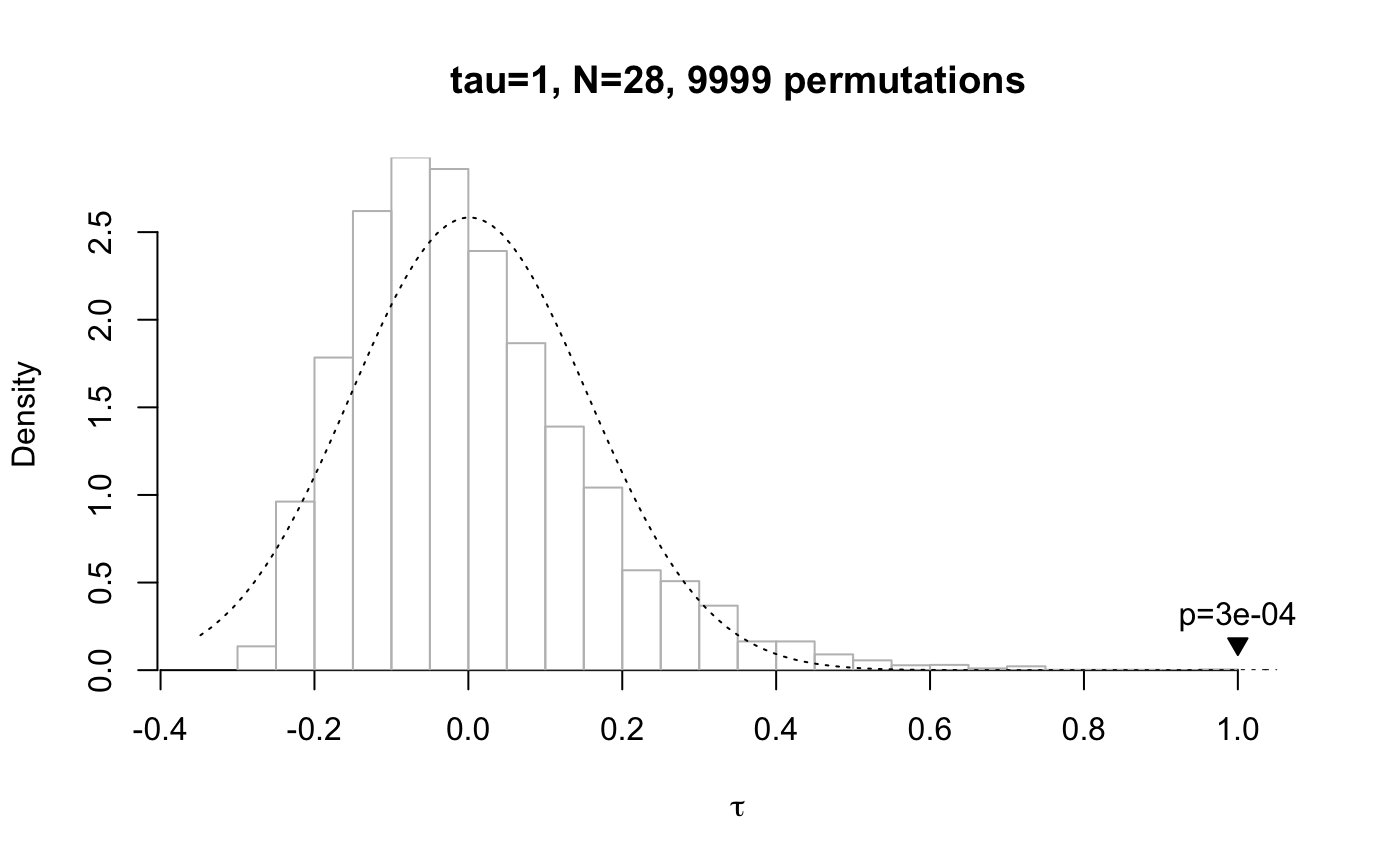
plot() called on a data frame of class mantel plots a
visualisation of the test results (in particular, the distribution of
the permutated samples against the veridical correlation coefficient). If
the veridical correlation coefficient is plotted in blue it means
that it was higher than all other coefficients generated by random
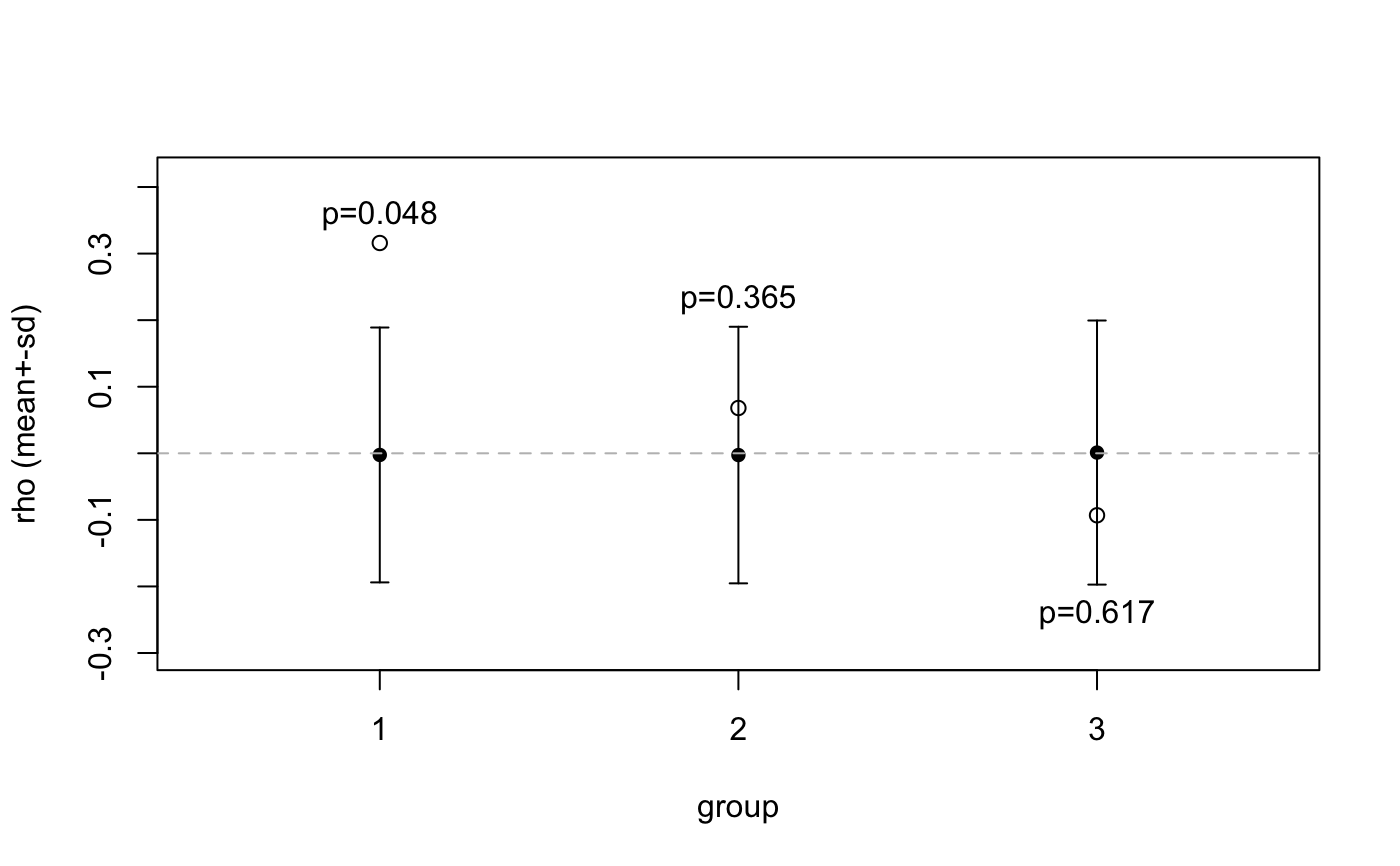
permutations of the data. When the argument contains the result of more than
one Mantel tests, a side-by-side boxplot visualisation shows the mean and
standard deviation of the randomised samples (see examples). Additional
parameters ... to plot() are passed on to
plot.default.
Methods (by class)
default: Perform Mantel correlation test on two distance matrices. The distance matrices can either be of typedist, plain R matrices or any object that can be interpreted bycheck.dist. The order of the two matrices does not matter unlessomitzerodistances = TRUE, in which case cells with a 0 in the second matrix are omitted from the calculation of the correlation coefficient. For consistency it is therefore recommended to always pass the string distance matrix first, meaning distance matrix second.formula: This function can be called with raw experimental result data frames, distance matrix calculation is taken care of internally.xis a formula of the types ~ m1 + m2 + ...wheresis the column name of the character strings in data frame or matrixy, whilem1etc. are the column names specifying the different meaning dimensions. To calculate the respective distances, the functionstringdistfunis applied to the strings,meaningdistfunto the meaning columns.list: Whenxis a list of distance matrices, andyis either a single distance matrix or a list of distance matrices the same length asx: runs a Mantel test for every pairwise combination of distance matrices inxandyand returns amantelobject with as many rows.
References
Dietz, E. J. 1983 “Permutation Tests for Association Between Two Distance Matrices.” Systematic Biology 32 (1): 21-–26. https://doi.org/10.1093/sysbio/32.1.21.
North, B. V., D. Curtis and P. C. Sham. 2002 “A Note on the Calculation of Empirical P Values from Monte Carlo Procedures.” The American Journal of Human Genetics 71 (2): 439-–41. https://doi.org/10.1086/341527.
See also
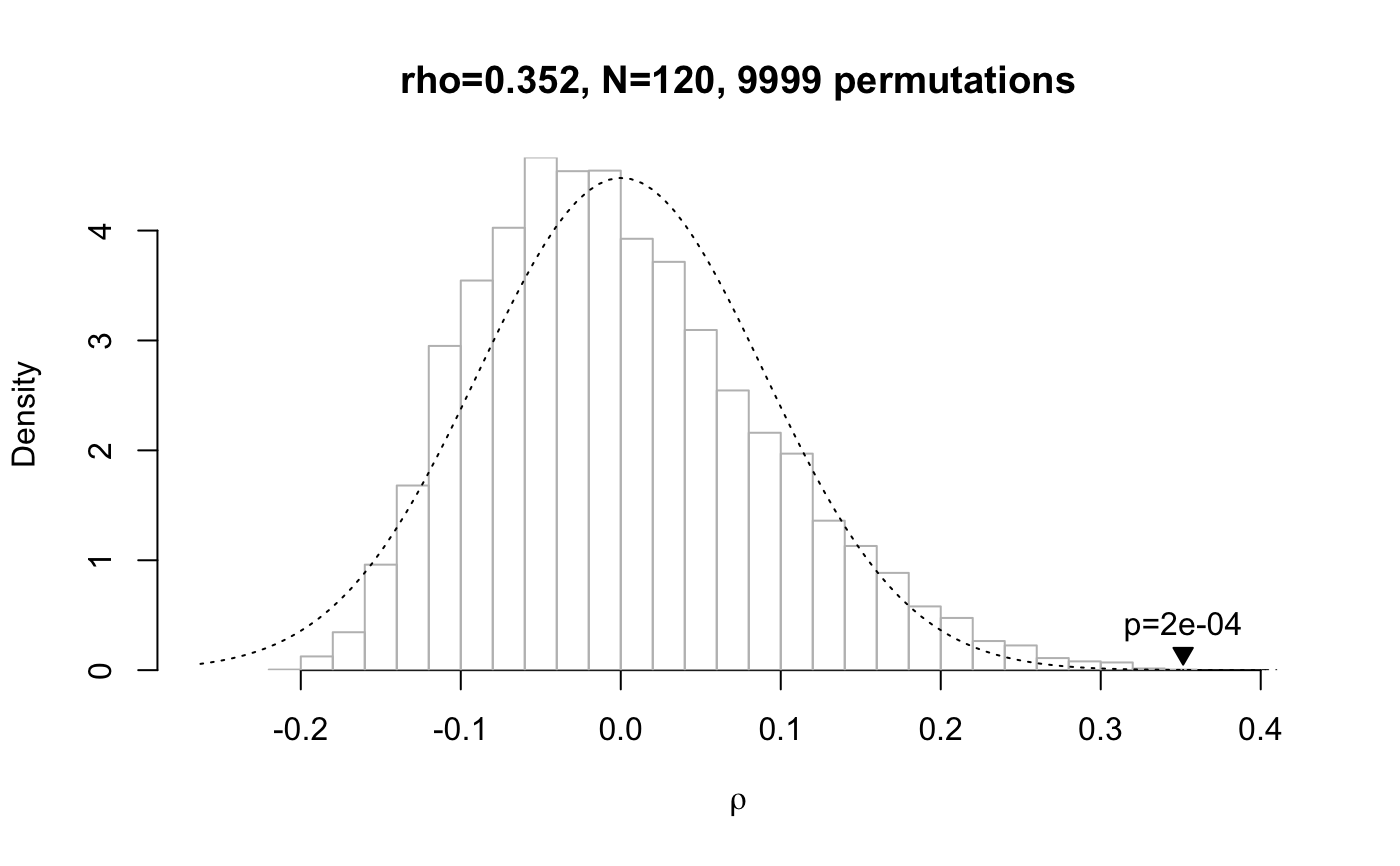
Examples
# small distance matrix, Mantel test run deterministically mantel.test(dist(1:7), dist(1:7))#>#> Mantel permutation test (method: spearman) #> r = 1, N = 21 #> 5040 permutations, mean = -8.02e-19, sd = 0.224 #> p (exact) = 0.000595 #># run test on smallest distance matrix which requires a random # permutation test, and plot it plot(mantel.test(dist(1:8), dist(1:8), method="kendall"))# 2x2x2x2 design mantel.test(hammingdists(enumerate.meaningcombinations(c(2, 2, 2, 2))), dist(1:16), plot=TRUE)#> Mantel permutation test (method: spearman) #> r = 0.352, N = 120 #> 9999 permutations, mean = 0.00031, sd = 0.0891 #> p (empirical) = 2e-04 #># using the formula interface in combination with a data frame: print(data <- cbind(word=c("aa", "ab", "ba", "bb"), enumerate.meaningcombinations(c(2, 2))))#> word Var2 Var1 #> [1,] "aa" "1" "3" #> [2,] "ab" "1" "4" #> [3,] "ba" "2" "3" #> [4,] "bb" "2" "4"mantel.test(word ~ Var1 + Var2, data)#>#> Mantel permutation test (method: spearman) #> r = 1, N = 6 #> 24 permutations, mean = 0, sd = 0.722 #> p (exact) = 0.36 #># pass a list of distance matrices as the first argument, but just one # distance matrix as the second argument: this runs separate tests on # the pairwise combinations of the first and second argument result <- mantel.test(list(dist(1:8), dist(sample(8:1)), dist(runif(8))), hammingdists(enumerate.meaningcombinations(c(2, 2, 2)))) # print the result of the three independently run permutation tests print(result)#> Group '1': #> Mantel permutation test (method: spearman) #> r = 0.316, N = 28 #> 9999 permutations, mean = -0.00248, sd = 0.191 #> p (empirical) = 0.0477 #> #> Group '2': #> Mantel permutation test (method: spearman) #> r = 0.068, N = 28 #> 9999 permutations, mean = -0.00263, sd = 0.193 #> p (empirical) = 0.365 #> #> Group '3': #> Mantel permutation test (method: spearman) #> r = -0.0931, N = 28 #> 9999 permutations, mean = 0.00111, sd = 0.198 #> p (empirical) = 0.617 #># show the three test results in one plot plot(result, xlab="group")