maps and mapping tools
borders
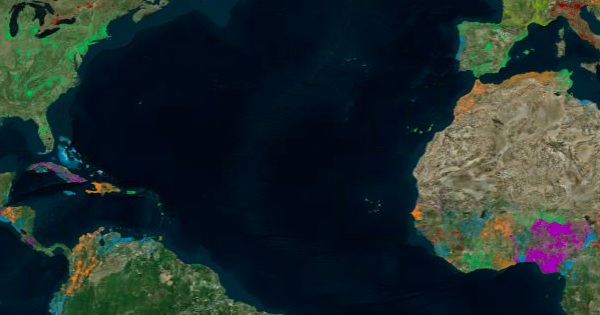
borders is an interactive web map exploring the concept of modern nation states as imagined communities. It is based on OpenLayers v4 and uses custom vector and raster tile sets (for country boundary and population density) created from open data using GDAL.
remap / overlay
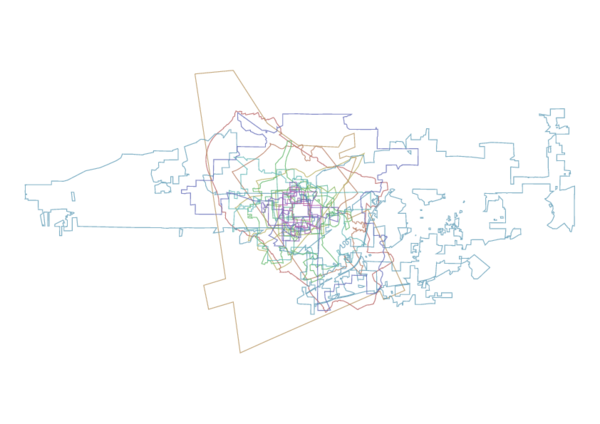
As both an avid flâneur and admirer of maps I’ve grappled with how cities differ on two levels: how we experience them directly, as well as how we perceive or recognize them based on cartographic representations. While the qualitative comparison of the “character” of different places is common practice, the arguably more appropriate quantitative juxtaposition of their geographies isn’t. In order to bring these two levels of comparison closer together I’ve been playing with representations which overlay different places onto each other while maintaining comparable projections and scales, something that modern web maps are unfortunately not geared towards. My favourite outcome of this tinkering is the map on the right, which shows Oxford in the United Kingdom as well the 18 Oxfords found across the United States, all superimposed on one another.
qgisremote R package and QGIS 2 plugin
For Google Summer of Code 2017, I implemented a QGIS Desktop plugin which allows other (‘mapping-deficient’) programming languages to make use of QGIS’ data processing and canvas drawing/styling functionalities. The project website can be found at http://qgisapi.gitlab.io.
physical activities and artefacts
While I lived in Edinburgh I used to walk with the Sunday Adventure Club and also exhibited some maps with The Residents Association.